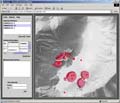
Example of layer tool showing the Kos-Nisyros-Yali-Tilos volcanic field. The background image consist of the shaded morphological map of the entire volcanic field overlain by the fault system (click on image to enlarge).
The analyzed data from two selected fumaroles in the “time series diagrams”. Any click on a data point will should the measured data (click on image to enlarge).
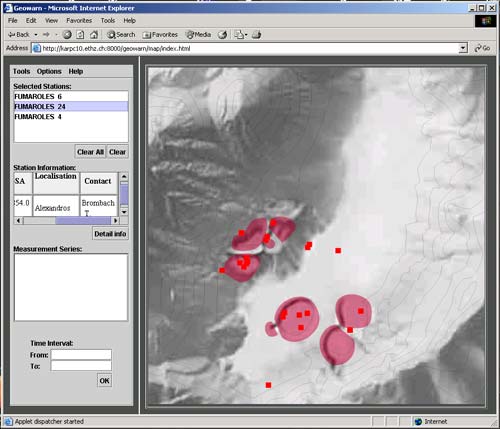
Diagram selection Tool with the position of the monitored fumaroles (click on image to enlarge).
Simulation of CO2 flux in a grid (Solfatara, Campi Flegrei) (click on image to enlarge).
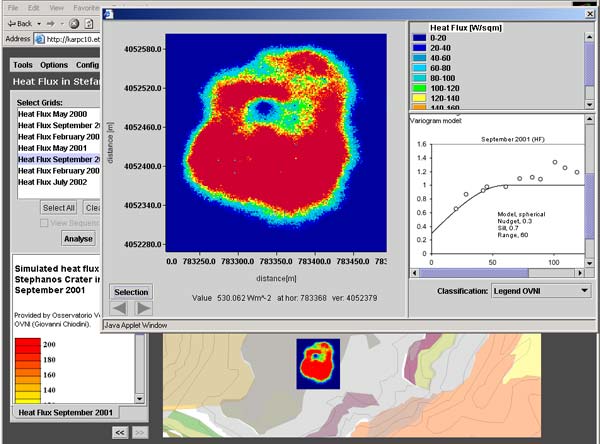
Example selecting a grid for “Grid Analysis”. In this case, the heat flux in Stefanos hydrothermal crater from the campaign September 2001 has been chosen (click on image to enlarge).
Explanatory information (pictures, videos, text and hyper-links) for specific localities (click on image to enlarge).
Example of layer tool showing Nisyros volcanic island. The generated interactive picture shows the geology, on the shaded relief and overlain with major topographic features (click on image to enlarge).
Same as figure above using “Zoom” functionality and additional overlays of faults and fumaroles (click on image to enlarge).
Example of layer tool showing Nisyros volcanic island. The generated interactive picture shows the slope stability map, overlain with contour lines and major topographic features (click on image to enlarge).
Same as figure above using “Zoom” functionality and the overlay of fumaroles (click on image to enlarge).
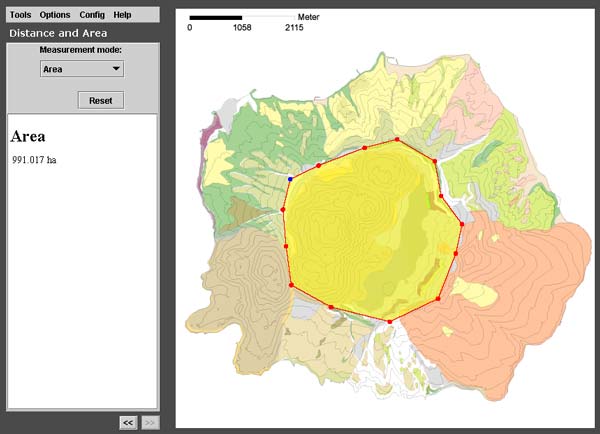
Area measurement of the main caldera (991 ha) of Nisyros island (click on image to enlarge).
Layer tool (zoomed-in geology) with example of position and opened HTML window (the 2001 rupture within the Lakki plain of the Nisyros caldera) (click on image to enlarge).
Diagram selection Tool, allowing the selection of thermal springs and showing the “station information” depending on the time interval of the measurements (click on image to enlarge).
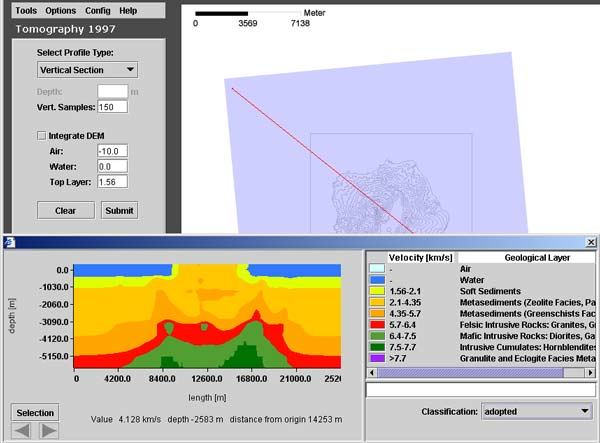
Three-dimensional tomographic voxel data is analyzed with the Tomography Tool. This example shows the vertical cross section and its selected position on the contour map of Nisyros The cross section appears on the bottom of the tool. A request has been sent to a server that extracted the cross section and send it back. Therefore, the Tomography tool requires a connection with a running GEOWARN server to extract the profiles. The cross section can then be analyzed with the Grid Analyst (click on image to enlarge).
Several methodologies are applied in a completely new way to achieve the necessary results.
Take a look at the software graphical user interface.
Watch illustrative movies of the project.
Back
Top
created by geopublic