GEOWARN
Geospatial warning systems
Project | GEOWARN Design | Transferability | Final Product | Innovation/Outlook


Home | Links | Site Map


Authors of www.geowarn.ethz.ch:
Prof. Dr. V.J. Dietrich
Institute for Mineralogy and Petrography
ETH Zürich

Prof. Dr. Lorenz Hurni
Institute of Cartography
ETH Zürich

The GEOWARN Design > The GEOWARN Spatial Database > Primary Graphic and Numeric Input Data

The GEOWARN Spatial Database

The first step in the creation of GEOWARN consisted in the design and the development of a relational spatial database following the "Georelational Model" using conventional commercial GIS software. The "Georelational Model" uses points, lines, polygons, and related attribute-tables to define spatial
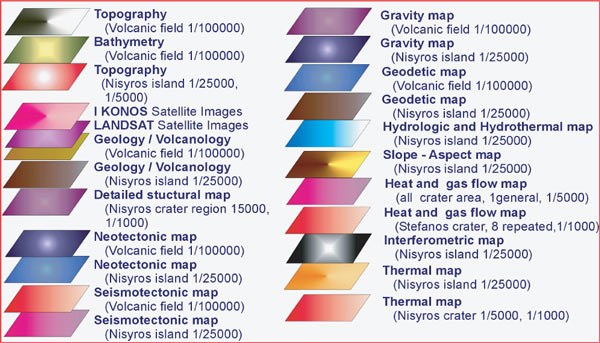
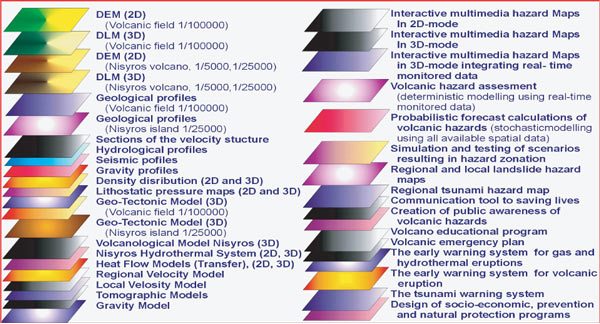
 object properties.

In the geodatabase, these model entities are represented as objects in attribute tables (attributes are properties, behaviour, and their relationships). For example, a well-object can be found within a library of objects with the entire attribute scheme attached.

The user can simply take it, place it on the map, and fill the data in the attached tables. The georelational and geodatabase models have some similarities. However, the geodatabase model represents a recent improvement in the implementation of the georelational model.

Primary Graphic and Numeric Input Data

Fig.38

Fig.38

Fig. 38 GEOWARN database comprising graphical and numerical geo-spatial data.
Swiss Federal Institute of Technology (ETHZ)
(Click on image to enlarge).

The database comprises the following graphical and numerical geo-spatial data:

1) Remote sensing data: Satellite images (e.g. infrared thermal imaging and 
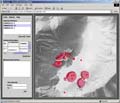
displacement observations analyzed by new interferometric image processing).

2) Real time monitoring: Surface movements derived from geodetic differential global positioning measurements; seismic activity; heat and gas fluxes and chemical changes in fumarolic gases and hydrothermal waters.

3) Deep crustal seismic soundings and active tomography, derived from signals from land and sea floor stations, using the new technology of ocean bottom seismographs, resulted in regional and local seismic models.

Integration of these independent parameters permitted the development of useful modeling techniques that are suitable for the detection of dynamic processes such as the reactivation of a quiescent volcano and earthquakes. To provide a good platform for analysis and correlation, various volcanic data sets were examined which show a high degree of heterogeneity. The chosen software solution was Arc/Info™ 8.1 (ESRI) in combination with MS Access™ (Microsoft).

Fig. 39 Interactive and user friendly cartographic representation of the entire data output set. Swiss Federal Institute of Technology (ETHZ)
(Click on image to enlarge).


Methodologies     

Several methodologies are applied in a completely new way to achieve the necessary results.


Software screenshots

Take a look at the software graphical user interface.

Screenshot

Movies                    

Watch illustrative movies of the project.


Logo geowarn

Logo IST

Logo ETH Zürich


Back

Top 


created by geopublic

© 2003 eth zürich Legal Disclaimer
!!! Dieses Dokument stammt aus dem ETH Web-Archiv und wird nicht mehr gepflegt !!!
!!! This document is stored in the ETH Web archive and is no longer maintained !!!