
|
|
| |

|
Project > Methodologies > Ground-based heat and CO2 flux measurements
Ground-based heat and CO2 flux measurementsHeat Flux Measurements CO2 Flux Monitoring and Diffuse Degassing Structures (DDS)Degassing is a continuous process, since gas is emitted from all types of magmas.
Most active volcanoes release volcanic gases as a surface expression of this
degassing process in the form of plumes, discrete fumarolic activity and soil
diffuse degassing. Recently, the use of new techniques for the measurement of diffuse CO2
fluxes permitted quantitative estimation of the gas-flow released in diffuse
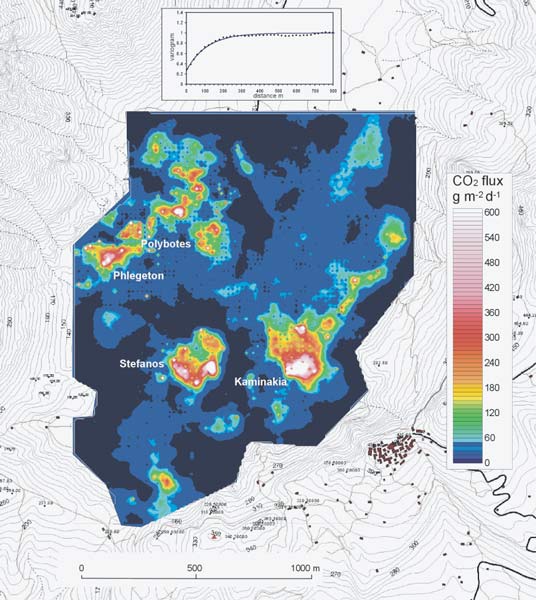
emission areas from different volcanic systems (Fig. 24). During the 1990's, a geochemical technique for measuring diffuse soil CO2 fluxes was developed. This method, called ”accumulation chamber time 0 method”, consists of the measurement of soil CO2 fluxes at many points (typical several hundreds) homogeneously distributed over the area of study. The quick measuring times (1-5 minutes) allow one to cover large areas in detail in relatively short times. CO2 flux data analysisThe total degassing output from the surveyed area can be estimated by means of statistical or geostatistical techniques. Two generally used statistical techniques are a) arithmetic averaging and b) a graphical-statistical approach. For surveillance purposes, the definition of the 'natural variability' is essential for the recognition of anomalous states. The new CO2 flux data analysis of Nisyros (Fig. 26) comprises a
geostatistical technique that consists of a probabilistic approach based on
stochastic simulation algorithms. Specifically, we used the Sequential Gaussian
Simulation algorithm (SGS) using the code of the GSLIB software. Fig. 26 CO2 flux at Lakki plain (the result of
200 simulations based on field measurements). Osservatorio Vesuviano Napoli
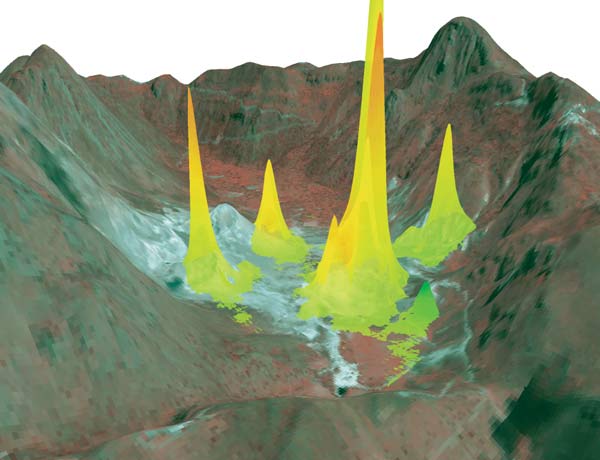
(OVNI) During one single campaign, 1.268 data points were used and arranged in a 20m spaced grid within the hydrothermal crater area of Nisyros. The simulation was performed by computing the flux values in 27,520 cells of 5 x 5 m each. The mean total CO2 output computed by E-estimate of 50 alternative realizations (i.e. linearly averaging all of the realizations) is 34.6 t d-1 (Ø = 3.8 t / d). Fig. 27 The CO2 flux (heights) / temperature (colours)
correlation from the hydrothermal craters in Nisyros during the seismic crisis
in November 1997 combined with the orthorectified 3D IKONOS satellite image.
Swiss Federal Institute of Technology (ETHZ)
|
|
||||||||||||||||||||||||||||||||||||||||||||||||||||||
|
© 2003 eth zürich | Legal Disclaimer |
|
!!! Dieses Dokument stammt aus dem ETH Web-Archiv und wird nicht mehr gepflegt !!!
!!! This document is stored in the ETH Web archive and is no longer maintained !!! |
||